
June ran at Stretch pace or better on three of five program KPIs
Engagements, comments, and LinkedIn clicks all cleared the monthly equivalent of the H2 Stretch line a full month before the H2 window opens on July 1.

June 2026 performance, brand, and delegate accounts
7/2/2026 | John Murdock | Social Media Marketing Pod
25,777
Impressions
Impressions, up 36.5% YoY
14,555
Total audience
Total audience across profiles
173
Published posts
Published posts, FB 84, IG 81, LI 8
Engagements, comments, and LinkedIn clicks all cleared the monthly equivalent of the H2 Stretch line a full month before the H2 window opens on July 1.
8 LinkedIn posts drove 1,089 engagements, 55 percent of all program engagement, plus 963 link clicks and 90 of the 123 new followers. The 25 Years Impact Summit series is the strongest content of the engagement so far.
Engagements up 85 percent, impressions up 36.5 percent, post link clicks up 1,320 percent, and net audience growth up 123.6 percent vs June 2025 on the same platform footprint.
123 net new followers vs a Target pace of 125 per month.
All Acelero Learning accounts, brand plus six delegates. Scored against baseline pace (Jan to May 2026 run rate) and the monthly equivalent of the H2 2026 Floor, Target, and Stretch tiers.
The H2 framework is cumulative July to December, so June is a readiness read, not an H2 result.
| Program KPI | Month actual | Baseline pace | Floor pace | Target pace | Stretch pace | Standing |
|---|---|---|---|---|---|---|
| Net follower growth | 123 | 96 | 96 | 125 | 153 | Above Floor, 98% of Target |
| Total engagement | 1,974 | 1,064 | 1,067 | 1,333 | 1,600 | Above Stretch |
| Shares | 60 | 28 | 35 | 45 | 60 | At Stretch |
| Comments | 135 | 25 | 25 | 35 | 45 | 3x Stretch |
| LinkedIn clicks | 963 | 255 | 255 | 317 | 400 | 2.4x Stretch |
0 cumulative
0.0%
0 cumulative
0.0%
0 cumulative
0.0%
0 cumulative
0.0%
0 cumulative
0.0%
*Note: H2 tiers are cumulative July to December totals divided by six for a monthly pace. The H2 window opens July 1, so June carries no cumulative progress. Full tier table: Floor 575 / 6,400 / 210 / 150 / 1,530. Target 750 / 8,000 / 270 / 210 / 1,900. Stretch 920 / 9,600 / 360 / 270 / 2,400.
Combined all delegates view
12,567
Views
Up 25.2% vs June 2025
708
Engagements
Up 3.3% vs June 2025
+9
Net followers
46 shares, 61 comments
84
Posts published
5.6% engagement rate
Brand FB, One teacher in one classroom, June 3: 1,666 impressions and 123 engagements, the top brand Facebook post of the month.
ALCC recruitment, There is a place for you this summer, June 8: 1,005 impressions, 82 engagements, 11 shares.
ALWI Woodland center grand opening, June 4: 991 impressions and 167 engagements, the top delegate engagement total.
Two delegate pages went net negative on followers, ALCC lost 3 and ALWI lost 1, both amid summer closure messaging.
Engagement grew 3.3 percent YoY against a 25 percent gain in views. Reach is recovering faster than interaction on Facebook.
The June 10 Summer is here post underperformed on every page it ran. Retire the copy.
Combined all delegates view
7,544
Views
First full YoY cycle on views
177
Engagements
Up 5.3% vs June 2025
+24
Net followers
68 comments, 9 shares
81
Posts published
275 Reel video views
ALCC Instagram led all delegate accounts with 4,439 views and 7 net new followers, 13 posts published.
ALMM summer learning carousel, June 16: 444 views and 7 shares, the top delegate Instagram share count of the month.
Every delegate Instagram account grew, no account lost followers on the platform.
Delegate Instagram remains structurally small. Most posts drew single digit engagement, the suppression cycle documented in the May audit persists.
Four accounts sit under 60 followers, ALDE at 18, ALWI at 58, ALSC at 53. Growth math stays slow until follower bases rebuild.
Engagement rate percentages from these micro accounts are excluded from headline reporting by design, see appendix.
Acelero Learning brand page
5,666
Impressions
Up 170.6% vs June 2025
1,089
Engagements
Up 635.8% vs June 2025
+90
Net followers
8,251 total audience
963
Link clicks
8 posts, 19.2% eng. rate
Eight posts produced 55 percent of all program engagement. The Impact Summit, 25 Years and Counting, Accelerate and Shine series was the driver: the June 12 post alone earned 533 engagements and the June 15 follow up added 309.
LinkedIn clicks, the highest value action in the KPI framework, ran at 963 for the month against a Stretch pace of 400. The careers link in recruitment adjacent posts is converting attention into site traffic.
73 percent of all June follower growth came from LinkedIn. The professional audience is compounding around the 25th anniversary narrative, which supports the case for a second leadership voice in H2.
P4 Rooted In Community under delivered by roughly 13 points, the only drift over the 10 point threshold. June carried no community anchored content beyond observances.
P1 ran about 5 points hot on the summer enrollment push, within tolerance.
Recruitment creative ran on delegate FB and IG while P5 is scoped as LinkedIn recruitment only. Recommend either re-scoping P5 or reclassifying delegate hiring posts.
Mix uses prior weights, P1 at 30 percent, until Heather confirms the new guide weights. The new guide shows P1 at 40 percent but the weights sum to 115 percent.
*Note: Actual mix is inferred from Sprout tags and captions. The post naming convention is not present in Sprout, so percentages are provisional. Reported by content type, not campaign.
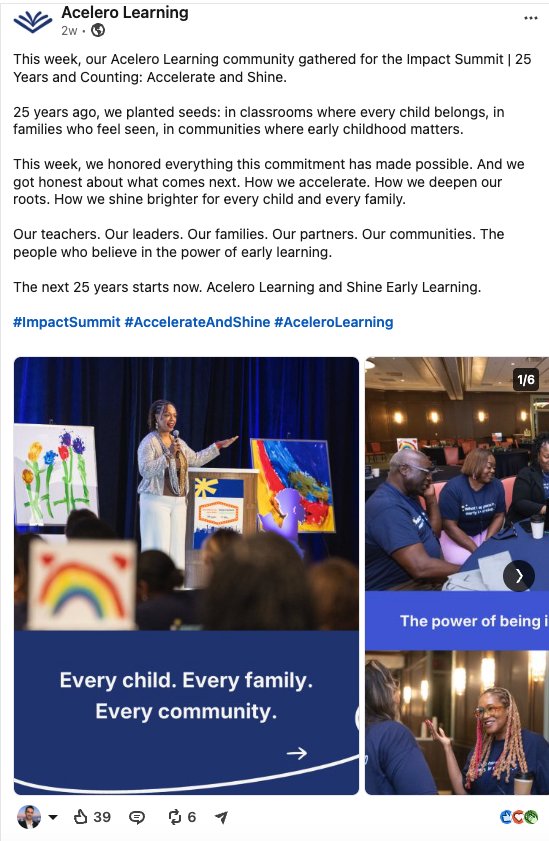
25 Years and CountingBrand LinkedIn, June 12
Anniversary storytelling with real event photography. Professional audience showed up for people and milestone content, not promotion.
533 engagements
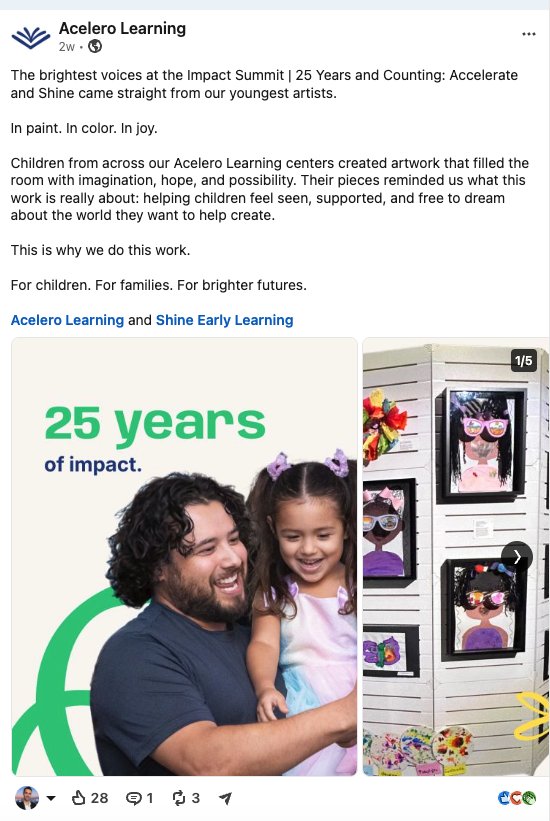
Impact SummitBrand LinkedIn, June 15
Momentum carry from the June 12 post. Series structure kept the audience returning, a repeatable pattern for H2.
309 engagements
One teacher in one classroomBrand Facebook, June 3
People forward brand storytelling. The strongest family facing reach of the month came from a staff story, not an enrollment ask.
1,666 impressions, 123 engagements
Woodland center grand openingALWI Facebook, June 4
Hyper local milestone with community pride built in. Grand openings are reliable engagement events, plan them into the calendar.
991 impressions, 167 engagements
There is a place for you this summerALCC Facebook, June 8
Recruitment framed as belonging. Warm hiring copy outperformed enrollment copy across delegate Facebook all month.
1,005 impressions, 82 engagements, 11 shares
A GA4 traffic acquisition report was included in the June sources, but site traffic figures were not presented in the June deck.
Section B · Delegate regions
Delegate regions
Six regional programs, each on Facebook and Instagram. Delegate sections use an identical structure month to month.
Clark County, Las Vegas, Nevada
| Audience | Net growth | Posts | Impressions | Engagements | |
|---|---|---|---|---|---|
| 1,185 | -3 | 11 | 3,359 | 231 | |
| 265 | +7 | 13 | 4,439 | 47 | |
| Region total | +4 | 24 | 7,798 | 278 |
30%
Share of program impressions
14%
Share of program engagements
+4
Net followers, region
Camden, New Jersey and Philadelphia, Pennsylvania
| Audience | Net growth | Posts | Impressions | Engagements | |
|---|---|---|---|---|---|
| 633 | +2 | 12 | 1,319 | 58 | |
| 379 | +5 | 11 | 911 | 21 | |
| Region total | +7 | 23 | 2,230 | 79 |
9%
Share of program impressions
4%
Share of program engagements
+7
Net followers, region
Milwaukee area, Wisconsin
| Audience | Net growth | Posts | Impressions | Engagements | |
|---|---|---|---|---|---|
| 842 | -1 | 21 | 4,146 | 284 | |
| 58 | +1 | 16 | 148 | 21 | |
| Region total | 0 | 37 | 4,294 | 305 |
17%
Share of program impressions
15%
Share of program engagements
0
Net followers, region
Monmouth and Middlesex Counties, New Jersey
| Audience | Net growth | Posts | Impressions | Engagements | |
|---|---|---|---|---|---|
| 603 | +2 | 11 | 835 | 35 | |
| 378 | +1 | 11 | 819 | 25 | |
| Region total | +3 | 22 | 1,654 | 60 |
6%
Share of program impressions
3%
Share of program engagements
+3
Net followers, region
Kent and Sussex Counties, Delaware
| Audience | Net growth | Posts | Impressions | Engagements | |
|---|---|---|---|---|---|
| 26 | +1 | 12 | 740 | 52 | |
| 18 | +2 | 11 | 64 | 24 | |
| Region total | +3 | 23 | 804 | 76 |
3%
Share of program impressions
4%
Share of program engagements
+3
Net followers, region
Aiken and Barnwell counties, South Carolina

| Audience | Net growth | Posts | Impressions | Engagements | |
|---|---|---|---|---|---|
| 27 | +1 | 12 | 422 | 32 | |
| 53 | +1 | 11 | 107 | 18 | |
| Region total | +2 | 23 | 529 | 50 |
2%
Share of program impressions
3%
Share of program engagements
+2
Net followers, region
*Note: Comparisons in the Sprout exports are June 2026 vs June 2025. May 2026 prior month data was not exported, see appendix. The H2 KPI framework is program level, delegate contribution is shown against program totals. Delegate LinkedIn and 250/25 content is excluded by design, that campaign runs on brand LinkedIn only.
Section C · Close
Learnings and next steps
Most delegate IG posts drew single digit engagement. The suppression cycle from the May audit persists. Follower base rebuild is the fix, not more posting volume.
Views grew 25 percent YoY but engagement grew only 3.3 percent. More people are seeing the content than acting on it. People forward and milestone posts are the proven levers.
Roughly 5 percent actual vs 18 percent planned. July and August calendars need community anchored concepts, not just observances.
The top post on ALCP, ALMM, and ALDE was a hiring post. Either re-scope P5 beyond LinkedIn or fold warm hiring creative into the delegate mix deliberately.
The H2 KPI window opens July 1. July is the first month scored against the cumulative Floor, Target, and Stretch tiers.
Summer closure runs June 29 to July 10 across delegate markets, early July cadence is reduced by design. Expect a soft first half on delegate reach.
August calendar production: back to school arc, First Days content, the 250/25 outcomes chapter on brand LinkedIn, and the Las Vegas summit staff story.
ALCC center closure takes effect in July, the 60 center count applies from July onward pending Andie's confirmation on any count bearing graphic.
| Account | Platform | Audience | Net growth | Posts | Impressions | Engagements | Eng. rate |
|---|---|---|---|---|---|---|---|
| Acelero Learning (brand) | 1,433 | +7 | 5 | 1,746 | 16 | 0.9% | |
| Acelero Learning (brand) | 395 | +7 | 8 | 1,056 | 21 | 2.0% | |
| Acelero Learning (brand) | 8,251 | +90 | 8 | 5,666 | 1,089 | 19.2% | |
| ALCC Clark County | 1,185 | -3 | 11 | 3,359 | 231 | 6.9% | |
| ALCC Clark County | 265 | +7 | 13 | 4,439 | 47 | 1.1% | |
| ALCP Camden/Philadelphia | 633 | +2 | 12 | 1,319 | 58 | 4.4% | |
| ALCP Camden/Philadelphia | 379 | +5 | 11 | 911 | 21 | 2.3% | |
| ALWI Wisconsin | 842 | -1 | 21 | 4,146 | 284 | 6.8% | |
| ALWI Wisconsin | 58 | +1 | 16 | 148 | 21 | ||
| ALMM Monmouth/Middlesex | 603 | +2 | 11 | 835 | 35 | 4.2% | |
| ALMM Monmouth/Middlesex | 378 | +1 | 11 | 819 | 25 | 3.1% | |
| ALDE Delaware | 26 | +1 | 12 | 740 | 52 | ||
| ALDE Delaware | 18 | +2 | 11 | 64 | 24 | ||
| ALSC South Carolina | 27 | +1 | 12 | 422 | 32 | ||
| ALSC South Carolina | 53 | +1 | 11 | 107 | 18 | ||
| Program total | All | 14,555 | +123 | 173 | 25,777 | 1,974 | 7.70% |
*Note: Shares and comments, platform level: Facebook 46 shares and 61 comments, Instagram 9 shares and 68 comments, LinkedIn 5 shares and 6 comments. LinkedIn link clicks 963, program post link clicks 994. Acelero Charitable Foundation page had zero activity and is excluded. Engagement rates from micro accounts are appendix only by design.
The H2 KPI framework is cumulative July to December. June is scored against baseline pace and the monthly equivalent of each tier as a readiness read. Per delegate tiers do not exist in the H2 framework, delegate contribution is shown vs program totals.
Source: 36 Sprout Social exports for June 1 to June 30, 2026, from the shared Box folder, covering brand and delegate accounts on Facebook, Instagram, and LinkedIn, plus a GA4 traffic acquisition report.
North star metrics: net follower growth, total engagement volume, shares, comments, and LinkedIn clicks. Engagement rate percentages from micro accounts are not foregrounded in headline reporting.
Reporting is by content type, not campaign. Delegate sections use an identical template for month to month comparability.
All performance comparisons in this deck are June 2026 vs June 2025. Prior month columns are not populated, no data was estimated.

